

Emma Broming and Rebecca Upton will be presenting PQC, Inc.’s research on Women Entrpereneurs’ Social Networks at the upcoming annual meeting of the Midwest Sociological Society. Ms. Broming and Dr. Upton will be presenting “Women Entrepreneurs and Social Networks: Promises and Pitfalls in the Work/Family Balance” on Saturday, April 1st in Milwaukee. More information about the MSS Annual Meeting is available here.
All posts by admin
The MBDA Releases PQC’s Report on Contracting Barriers
The U.S. Department of Commerce, Minority Business Development Agency today released a new report, Contracting Barriers and Factors Affecting Minority Business Enterprises: A Review of Existing Disparity Studies. The report, which spotlights disparities in state and local government contracting between minority-owned and nonminority-owned business enterprises, provides an in-depth review and analysis of disparity studies, summaries, and reports.
NWBC Releases PQC’s Report on Corporate Supplier Diversity
New Report Provides Recommendations to Increase Women Business Owners’ Access to Private Markets Through Supplier Diversity Programs
National Women’s Business Council report analyzes U.S. corporate supplier diversity programs and points to key areas in which suppliers, corporations and policymakers can work better together to scale-up and grow women-owned businesses.
WASHINGTON – December 7, 2016 – The National Women’s Business Council (NWBC) today unveiled a new report highlighting strengths and challenges of U.S. corporate supplier diversity programs and revealing areas for suggested policymaker support, as well as recommendations for women business owners and corporations. Supply and Demand Perspectives on Women’s Participation in Corporate Supplier Diversity Programs, prepared for NWBC by Premier Quantitative Consulting, Inc., details findings from three complementary studies to further women’s access to the corporate marketplace.
“There are more than 10 million women-owned businesses in this country, but while women-owned businesses make up more than a third of the nation’s privately-held businesses, only 3.4 percent of women-owned firms generate $500,000 or more in annual revenues,” said Carla Harris, Chair of the National Women’s Business Council. “This report presents a multi-dimensional look into the supplier diversity programs that support women-owned businesses to scale up and grow, and outlines key areas in which suppliers, corporations, and policymakers can work better together to open up this vast private market.”
The report is comprised of three separate studies that provide a snapshot of current corporate supplier diversity programs from the perspectives of supply and demand: a statistical analysis of a survey of women business owners, a review of the public-facing side of S&P 500 corporations’ supplier diversity programs and a synthesis of in-depth interviews with 15 corporate supplier diversity managers. Several areas demonstrated high potential for improved collaboration between policymakers, corporations, and women-owned small businesses. In particular, these groups can work together to:
- Improve transparency about supplier diversity program offerings and contract requirements –Corporations that publicly share contracting expectations and requirements, and supplier diversity program offerings, will improve efficiency in the contracting process, for both themselves and the diverse suppliers seeking contracts. Government can play a role in encouraging this increased transparency, including through sharing best practices learned from federal procurement successes.
- Engage “growth scaffolding” opportunities, particularly for women-owned businesses – Corporations and suppliers benefit from interim “scale up” steps, such as Tier 2 contract opportunities. Government can encourage the “growth scaffolding” of women-owned businesses by developing and promoting capacity assessments for business owners and by publicly celebrating, along with encouraging, well-developed Tier 2 corporate supplier diversity programs.
- Increase corporations’ purchasing commitment to women owned businesses –Government can support the expansion of supplier diversity efforts towards women entrepreneurs by creating incentives to do more business, not only with small businesses in general, but with women owned businesses specifically.
By following these recommendations to encourage corporations’ efforts to contract with a diverse pool of suppliers, policymakers can support the success of women-owned businesses nationwide and improve opportunities for women to access the corporate supply chain, thereby strengthening the overall U.S. economy.
###
About the National Women’s Business Council
The National Women’s Business Council (NWBC) is a non-partisan federal advisory council created to serve as an independent source of advice and counsel to the U.S. Small Business Administration, Congress and the White House on issues of impact and importance to women business owners, leaders and entrepreneurs.
About Premier Quantitative Consulting, Inc.
Premier Quantitative Consulting, Inc. (PQC) is a small economic, valuation, and quantitative research consulting firm. PQC provides consulting services to corporations, small business owners, law firms, and governments at the local, state, national, and international levels.
What do Women Business Owners Say About Corporate Supplier Diversity Programs?
We recently published Part 1 of our research into women business owner’s participation in corporate supplier diversity programs (see previous post). In this post, we highlight some of the key conclusions of our initial (and ongoing) research, using the results of the NWBC-sponsored survey:
- The most in-demand program offering was “introductions,” with approximately 75 percent of respondents indicating that they are “likely” to participate in that component of a program. This emphasizes that the entrepreneurial social network is a key component in starting and growing businesses, particularly in regards to securing contracts with large corporations.
- The number one impediment faced was the lack of contacts with decision-makers, closely followed by the lack of relationships with actual buyers. The quantitative results are confirmed by the focus group transcripts: women felt that accessing an individual who could actually execute a contract and hire them was a major impediment and barrier yet to be removed.
- Respondents were less interested in participating in mentorship and training than they were in meeting decision-makers. Approximately 25 percent of individuals surveyed indicated that they were not likely to participate in a mentorship and training program. Respondents noted that actually interacting with the buyers was an essential step to demonstrating capability and securing a contract.
- Women did not feel that they lacked capacity to meet the demand of large corporations. In fact, only 12.5 percent of respondents selected this choice. Women felt more hampered by the complexity and bureaucracy of the contracting process, as over 48 percent of survey respondents selected this barrier.
- A major finding of this work is that the barriers faced by women entrepreneurs in supplying large corporations do not vary greatly by revenue. This indicates that the gap in women’s participation as corporate suppliers is not entirely a function of capacity; rather other factors including politics and social networking are at play.
For the full report, click here!
Research on Women’s Participation in Corporate Supplier Diversity Programs, Part 1
The National Women’s Business Council (NWBC) recently released part 1 of our investigation into women’s participation in corporate supplier diversity program. As part of this initial research effort, PQC’s Emma Broming directed the quantitative analysis of an NWBC-sponsored survey that obtained feedback on women business owners interaction with, and use of, corporate supplier diversity programs.
As noted by PQC and echoed by the NWBC, corporate supplier diversity programs are a “win-win” for customers and suppliers as they positively affect the marketplace by increasing the number of qualified and experienced members of the supply chain. For women-owned firms, corporate supplier diversity programs can serve as a critical pathway to corporate market access as contracting with large corporations is an opportunity for women business owners to develop stable revenue streams, enhance their social networks, and scale up their businesses. Private and public corporations initiate supplier diversity programs to incorporate women- and minority-owned businesses into their procurement processes across the supply chain. The stability and connections developed within high quality programs may advance growth-oriented and scale-up women business owners in intensifying and expanding their businesses.
The complete report is currently available on the NWBC website!
Attend the Upcoming WBENC Conference in Orlando!
A quick plug for one of the best conferences each year – the annual WBENC National Conference & Business Fair, held in our very-own hometown of Orlando, Florida! The conference will be held June 21-23 this year, with details and registration information available here.
Minority-Owned Firms and Federal Procurement – What Do the Dollars Show?
We recently took a look at minority-owned firms and federal procurement contracting data for fiscal years 2012 through 2014 as part of our ongoing research into federal procurement activity by women- and minority-owned firms. In this blog post, we present some initial data with respect to minority-owned firms, focusing on overall and industry-specific contracting trends.
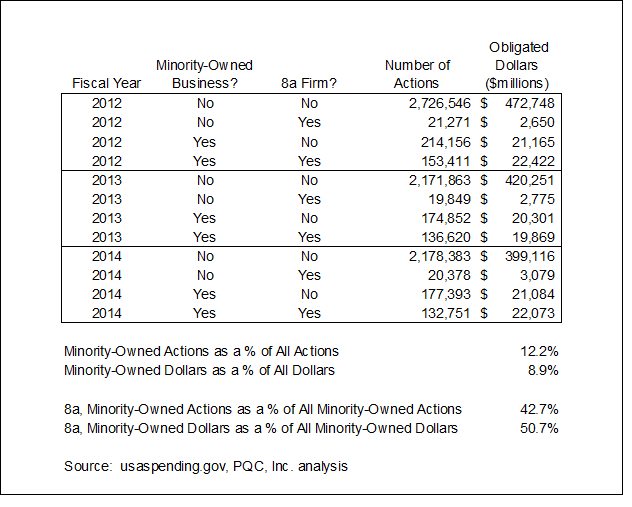
In examining federal procurement activity for minority-owned firms, we analyzed federal procurement data[1] for three fiscal years (2012 through 2014) and tabulated data based on several key identifiers, including fiscal year, DUNS number, obligated dollar amount, NAICS code[2], and flags for minority-owned business status and 8(a) status. Table 1 summarizes aggregate procurement activity by fiscal year, minority-owned status[3], 8(a) status, the number of actions and dollars obligated. The data indicate that during the relevant time period, minority-owned businesses accounted for 8.9 percent of the total dollars obligated.[4] In addition, approximately 51 percent of the dollars obligated to minority-owned firms were attributable to 8(a) firms.
Table 1
 Diving deeper on an industry-level basis, we found significant variation in minority-owned firm activity based on particular NAICS codes. We first investigated the ten NAICS codes that accounted for the most dollars obligated in FY2012 through FY2014. Table 2 presents these data.
Table 2
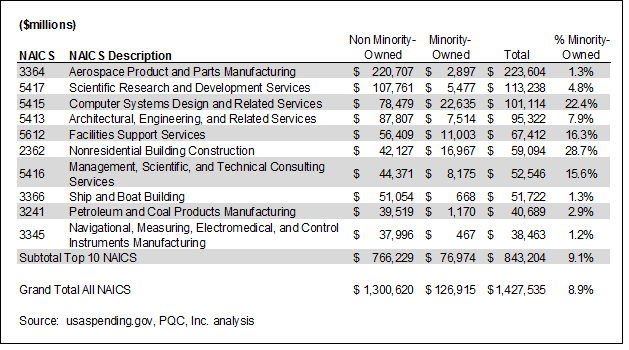
Large differences existed in the level of minority-owned firm participation between different NAICS codes. For example, minority-owned firms accounted for 28.7 percent of total dollars obligated in NAICS 2362 – Nonresidential Building Construction, yet accounted for only 4.8 percent of total dollars obligated in NAICS 5417 – Scientific Research and Development Services. There are a number of reasons which might explain these observed differences, including both the number of minority-owned firms operating within a particular NAICS code, the size of particular awards in an NAICS code, the contracting mechanism (i.e., obligated dollars could be associated with a larger procurement instrument) and a host of potential economic and procurement issues that influence whether a particular firm engaged in federal procurement within an industry. Indeed, disparity studies are often a cornerstone of evaluating existing policies and programs designed to facilitate contracting activity among underrepresented groups.
We expand the analysis to focus on the NAICS codes with the largest dollar amount obligated to minority-owned firms. Table 3 summarizes these data, which have significant overlap with Table 2. Exceptions are noted in bold and italics, representing NAICS codes in Table 3 that do not appear in Table 2.
Table 3
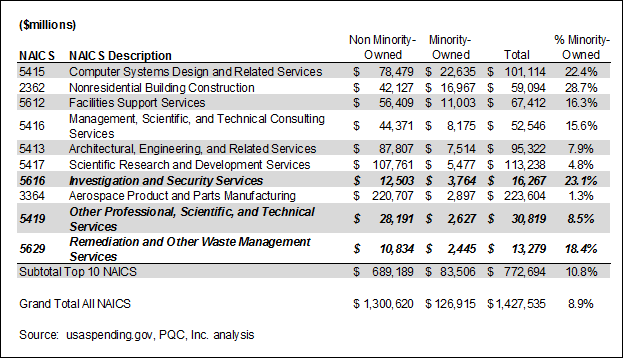
The data indicate that for 7 of the top 10 NAICS codes for minority-owned firms, the utilization (as measured in percent of total dollars awarded to minority-owned businesses) exceeds the overall minority-owned business average of 8.9 percent. Exceptions include NAICS 3364 – Aerospace Product and Parts Manufacturing (which is dominated by several large conglomerates), as well as NAICS 5413 – Architectural, Engineering and Related Services (at 7.9 percent) and the aforementioned NAICS 5417 (at 4.8 percent).
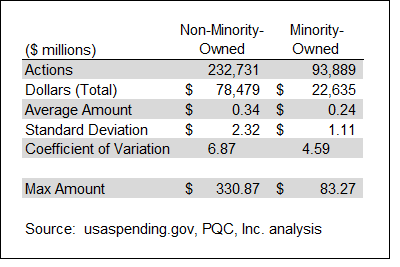
As part of our investigation, we examined the largest NAICS code for minority-owned activity based on dollars (NAICS 5415 – Computer Systems Design and Related Services). Table 4 presents a comparison of key metrics between minority- and non-minority-owned firms in this NAICS code. Interestingly, the average dollar amount per contract action is significantly lower for minority-owned firms ($240,000 versus $340,000), although the coefficient of variation is also lower.[5] One reason for this observation is the presence of several large contract actions. Notably, the maximum amount for a non-minority-owned firm is approximately $331 million, which is almost four times greater than the maximum contract action for a minority-owned firm.
Table 4
 In future blog posts, we will continue to share insights into federal procurement activities for minority- and women-owned firms. As always, if you need any assistance with market research regarding contracting activity, disparity study analysis, or federal procurement assistance, do not hesitate to reach out and contact us!
[1] We used data from usaspending.gov, which captures data from the Federal Procurement Data System – Next Generation (FPDS-NG).
[2] NAICS refers to the North American Industrial Classification System, which categorizes industry-level activity into a series of 6 digit NAICS codes. Primary NAICS categories are captured at the initial 2 digits, with each successive digit providing a greater level of detail and less aggregation.
[3] This flag indicates whether a firm “self-reports” as a minority-owned firm.
[4] To place the 8.9 percent value in context, recent Census data indicate that as of 2012, there were approximately 8.0 million minority-owned firms, up from 5.8 million in 2007. The Census data also indicate the 8.0 million minority-owned firms represent 29 percent of all firms with or without paid employees in 2012. See http://factfinder.census.gov/faces/tableservices/jsf/pages/productview.xhtml?src=bkmk.
[5] The coefficient of variation is the standard deviation divided by the mean. It is a measure of dispersion in a particular distribution. A higher coefficient of variation indicates a higher variation.
Today is the Day for the NWBC Quarterly Meeting
Today is the day for the NWBC’s quarterly meeting, “The Tipping Point for Women’s Entrepreneurship: It’s Her Time.” We encourage everyone to listen in to this free public event. For more information, please visit the NWBC web site!
A Plug for the National Association of Certified Valuators and Analysts (NACVA) Annual Conference
As we enter 2016, we look forward to a number of different valuation-related conferences, including NACVA’s Annual Consultant Conference in San Diego, June 9-11, 2016. One of our senior consultants (Lee O. Upton, III) is a past presenter at a NACVA’s Advanced Business Valuation Symposiumsand is looking forward to attending the annual convention this year. So with that in mind, a plug for the NACVA Conference in this blog post as we continue to work on more data-intensive blog posts over the next few weeks!
Intangible Asset and Intellectual Property Valuation – Part 3
In this final part of our series, we take a very brief look at the income approach.
Often, the most relied upon approach in valuing intangible assets is the income approach. In this approach, we determine intangible asset value by examining the future or expected economic benefit (i.e., income or cash flows) attributable to the intangible asset. There are a number of variations of the income approach, including direct capitalization models that rely on a single period of forecasted economic benefit and discounted cash flow models that explore longer forecast horizons. Both of these methods are loosely premised on four steps: (1) the determination of an appropriate income measure, (2) the estimation of a time period, (3) the projection of the income, and (4) the appropriate determination of a capitalization or discount rate that captures the risk associated with the expectation of receiving the economic benefit from the intangible asset.
A discounted cash flow method results in an intangible asset value derived from the sum of the present value of a stream of income attributable to the intangible asset over its life (or the economic useful life if subject to limitations such as patent term or licensing agreement). One could argue that this method is preferable to a single period capitalization method (which is based on the assumption of constant-growth income), as it allows for changes in the income stream at discrete periods of time in the future. Nevertheless, there are times when data availability and limitations restrict practitioners to using a single period capitalization approach.
In addition to these two general income approaches there are numerous other approaches that can be labeled “Income” or “Market” approaches; these include incremental income or excess earnings approaches, the profit split method, and royalty analyses. The incremental income approaches, which can include capitalized and discounted cash flow methods, are based on examination of the additional income accrued by the existence of the intangible asset. The profit split method looks to split the income between the intangible asset and other tangible and intangible assets associated with it. The key to this method is the determination of the appropriate split of the profit, where one often looks to market transactions regarding royalty or transfer agreements. Finally, royalty analyses examine the payment a licensee pays a licensor for use of a discrete intangible asset. These methods can be based on the actual royalty income or hypothetical royalty income.
The “royalty cost savings” or “relief from royalty” approach is one method based on the premise of hypothetical royalty income. Here, we are concerned with the economic benefit obtained by not having to license the intangible asset from another party. The value of the intangible asset can be examined by looking at the present value of the income saved by not having to pay the royalty. For example, suppose we are interested in determining the value of a particular brand name. Through our research we have determined that 2016 sales will be $100 million, the long-term growth rate is 3 percent, the income tax rate is 37 percent, and our appropriate discount rate is 15 percent. In addition, after extensive review of market data we can determine that a market-derived royalty rate of 20 percent of sales is accurate.
To determine the intangible value of our brand, we capitalize the after-tax brand royalty sales using our discount rate and long-term growth rate. Thus, our after-tax brand royalty sales are $12.6 million ($100 million times 20 percent times one minus the tax rate of 37 percent). The value of the intangible asset is $105 million, which is the $12.6 million divided by a capitalization rate of 12 percent (our 15 percent discount rate less our 3 percent long-term growth rate). Although this is a very simplified example, it illustrates the conceptual methodology of the relief from royalty method.
Regardless of the method, of which there are many, it is essential to fully understand the specific intangible asset in question, to determine the purpose of the valuation, and, of course, to consider a variety of valuation methods. Each method has its pros and cons, given the often subjective and data-intensive nature of valuation. The one key to remember is to never forget the ultimate goal: to reach a final conclusion of the value that best represents the intangible asset.
Need help with understanding valuation concepts related to your intellectual property? Contact us for more information.