Tag Archives: brand

Intangible Assets and Intellectual Property Valuation – Part 1

A rapidly changing global business environment continues to lead to heightened awareness of intellectual property matters among business executives, academics and government officials. Multinational taxation, capital budgeting, mergers and acquisitions (including spin-offs), patent litigation, licensing agreements, and brand names and trademark issues represent just a few of the intellectual property issues many businesses face on a daily business. One question we are asked over and over again, is “do we value intangible assets and intellectual property?” Our answer depends on the nature of the intangible assets and the purpose of the valuation.

The goal of this blog entry is to provide an introduction to intangible assets which will allow readers to fully understand how the appropriate valuation of intangible assets is essential to a number of intellectual property matters. In part 1, we cover intangible asset definition before considering valuation issues in a subsequent post.

What Are Intangible Assets?

Although a seemingly straightforward question, we immediately see that intangible asset valuation can often be a subjective and complicated issue. The answer to our question depends largely on whom you ask. Different valuation experts and valuation organizations have varying definitions, often depending on the specific purpose and function of the intangible asset under consideration.

For the purpose of this discussion, one of the best definitions of intangible assets can be found in Robert Reilly and Robert Schweihs’ book, Valuing Intangible Assets. The authors define intangible assets in a narrow sense, applying a set of strict criteria, including that an intangible asset has the following attributes:

• Not physical in nature
• Specific identification and recognizable description
• Legal existence and legal protection
• Subject to private ownership and transferability
• Tangible evidence or manifestation of the intangible asset
• An identifiable “birth date”
• Subject to termination

It should be noted that all of these points, except for the first one, are applicable to tangible assets as well as intangible assets. It is important to remember the distinction between that which is tangible, e.g., physical in nature and touch, and that which is intangible. Generally, intangible assets fall into a variety of categories, with some common ones listed below including an example of each.

• Marketing (brand names and trademarks)
• Technology (patents, processes, schematics)
• Artistic (musical compositions)
• Customer (customer lists)
• Contract (license agreement)
• Human Capital (workforce-in-place)
• Location (leasehold interest)
• Goodwill and Going Concern

Clearly there is some commonality among these categories. They are not meant to be exclusive, but rather an indication of the wide variety of intangible assets present in today’s business environment. Furthermore, intangible assets are not a new occurrence, as many of the above categories (and intangible assets) have been around for a long time. What has changed is the value that is placed on intangible assets, thereby creating a wide variety of reasons to try and place a value on them. Understanding the reason for the intangible asset valuation, whether for tax purposes, corporate planning, or dispute resolution, is paramount when considering the nature of the intangible asset under investigation.

Intellectual property, on the other hand, is often considered a subset of intangible assets — those that are “creations of the mind” and include artistic materials, patents, trademarks, etc. Intellectual property is most often considered in the context of litigation, or the field of intellectual property law. However, the boundaries of the intellectual property definition have migrated to include the innovative processes that create valuable intangible assets.

Why Do We Value Intangible Assets?

The reasons for valuing intangible assets and intellectual property are as diverse as the intangible assets themselves. In this section, we briefly touch upon several of the more common reasons for valuing intellectual property.

Tax Purposes

Multinational companies face a wide variety of challenging tax issues involving intellectual property. One example involves the licensing of intellectual property between domestic and foreign entities. Under Section 482 of the Internal Revenue Code, the appropriate transfer prices are subject to review by the Internal Revenue Service. Companies are required to justify intercompany transfer prices concerning the licensing and use of intellectual property by various foreign and domestic entities. A second example involves cost sharing agreements (CSAs). CSAs are one area where the IRS focuses a considerable amount of attention. A cost sharing agreement represents an agreement between two or more parties to share the costs to develop one or more intangibles in proportion to reasonably anticipated benefits from the individual exploitation of interests in the intangibles that are developed. Multinational companies may use CSAs to shift profit to low tax jurisdictions, resulting in lower taxes and higher earnings.

Patent Litigation

One of the most important intellectual property matters facing creative and innovative companies is the protection of valuable patents. Patent infringement is often a complex issue which requires a diligent review of the value of the patent and related intellectual property. In litigation proceedings, companies and attorneys look to valuation experts to appropriately value the intellectual property and patents which might have been infringed upon. Combining valuation practice with economic damage analysis will assist the courts in assessing the potential liability in patent infringement cases. The starting point is an assessment of the value of the intellectual property.

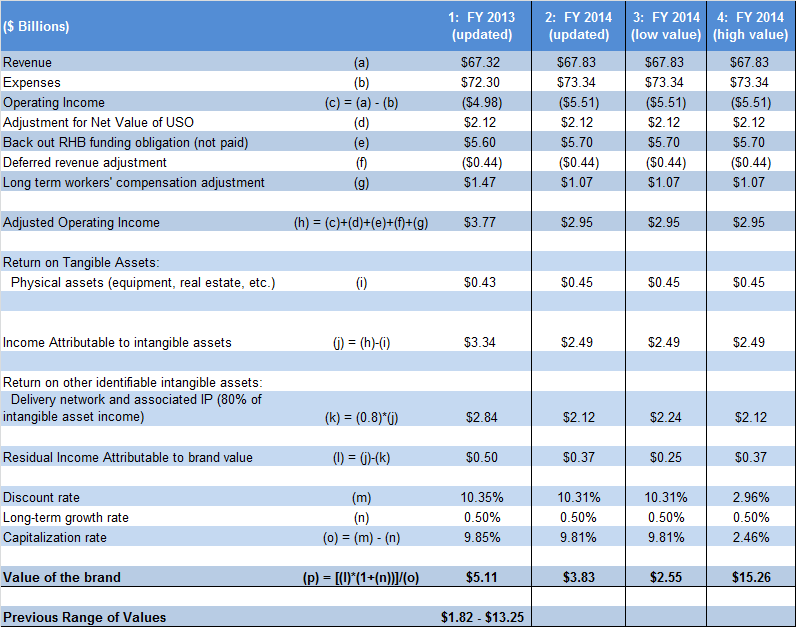
Brand Name and Trademark Valuation

Another equally important valuation issue facing business managers is the appropriate determination of the value of brand names and trademarks. One example involves the licensing of trademark use by third-parties. Companies need to recognize that the value of the trademark will dictate the appropriate compensation for use and disposition of the trademark by third parties. In a global business environment, which includes brand names and trademarks valued in the billions of dollars, understanding the true value of a company’s trademarks and brand names is essential for protecting brand equity and recognition.

Mergers and Acquisitions

When a company elects to divest a business segment with valuable intangible assets, the sale price will depend on an accurate valuation of assets, including intellectual property. At the heart of this issue is the perceived future economic benefit a willing buyer might receive through the acquisition and use of the intellectual property. As a result, valuation experts must employ sound valuation theory in assessing the true value of the intangible assets and intellectual property.

In our next post, we explore some of the valuation issues and methods related to intangible assets and intellectual property.

Do you need intangible asset or intellectual property valuation assistance?  For more information, contact us.

Updating the Value of the USPS Corporate Brand – Part 2

In our previous blog post, we updated the PQC USPS corporate brand valuation model with FY2014 data. The result ($6.23 billion) is a considerable increase over the value computed using the FY2013 data. In this blog post we consider why the value increased and whether the increase is reasonable.

A review of the financial data indicates that the large increase in brand value is due to volatility and changes in several balance sheet liabilities that are critical pieces when normalizing the operating income in the residual income approach. These include:

  1. The FY2013 financial data included a $1.32 billion one-time adjustment for a deferred revenue liability. No such adjustment exists in FY2014.
  1. The other adjustment is a recurring item, where the long-term workers’ compensation adjustment is significantly different (and flips sign) in FY2014 compared to FY2013. The primary reason is due to discount rate changes related to workers’ compensation liability.

These two adjustments have the cumulative effect of yielding a FY2014 “normalized” income stream that is 58 percent higher than the FY2013 normalized income stream. Herein we explore the value difference issue, where the mechanical application of the residual income approach ignores the need to apply sound judgment year to year when implementing the approach. As we continue through the computation , the net effect is that brand-level cash flows (i.e., the residual) and thus, brand value, are also significantly higher when using FY2014 data compared to FY2013 data (and holding all other assumptions constant). This increase begs the question whether the higher GAAP adjusted profits truly translate to a 72 percent increase in the corporate brand value!

Does this mean that our initial brand valuation model and results are invalid? In our opinion the answer to this question is no, understanding that the FY2014 results are a formulaic output without considering the reasonableness of the normalized income stream in light of year to year changes. If anything, the FY2014 analysis allows us to revisit the formulaic approach and assumptions within the residual income approach to help calibrate the model with respect to inputs.

For the two major adjustments discussed above, we consider the following alternatives:

  1. The deferred revenue adjustment was booked in FY2013, yet has applicability to the estimated liability for “Forever” stamps sold in multiple prior years. One alternative treatment is to amortize the deferred revenue adjustment over several years to smooth the effect on this one time change in an accounting estimate.
  1. The long-term workers’ compensation adjustment exhibits tremendous volatility on a year-to-year basis. In order to control and help smooth out this volatility, one alternative is to look at a multi-year average to include as the adjustment (e.g., three-year rolling average adjustment). So instead of backing out a negative 310 million adjustment in FY2013 and a positive $1,180 million adjustment in FY2014, we look at what the average adjustment is in the three years prior to and including our particular year.

By examining multi-year financial data for normalizing adjustments, we are able to smooth out the financial volatility that can yield potentially anomalous results once input into the purely formulaic residual income approach.

However, we also need to consider other valuation assumptions, which we deferred on in our prior blog post and update (setting the stage for this blog post!). In our original valuation model and white paper, we relied upon Postal Regulatory Commission (PRC) estimates for the net value of the universal service obligation (USO). At the time, we did not have 2013 estimates and we relied on 2012 estimates. The PRC has since updated the calculations, allowing us to include the 2013 estimates in our original model, while also relying on these values for 2014 (as the PRC has not released a 2014 estimate as of yet). Table 1 provides a comparison of the FY2013 and FY2014 brand value calculations using the residual income approach but with a multi-year average for the normalizing adjustments (#1 and #2 above) and updating the USO estimate. These are shown in the first two computational columns of Table 1.

Post 2 table 1

In examining the first two columns of Table 1, we note that updating the FY2013 brand value calculations leads to an increase (from our prior $3.63 billion to $5.11 billion), while the FY2014 brand value is now lower than the FY2013 value.

So what is the “right” answer?

The answer is not necessarily a straightforward point estimate. This is particularly true given our use of historical data as a proxy for a forward-looking income stream. In an ideal world, we might have proprietary brand cash flow or other financial projections, expectations and strategies to incorporate in our model. Absent the forecast element, we rely on historical data to forecast the future, which lends support to expressing a range of values given the limitations raised by the model constraints (e.g., use of public data, transparent and easily reproducible).

Nevertheless, in our original white paper we noted the significant influence of key valuation assumptions such as the identification and impact of brand attributes on brand equity and value. Furthermore, the assessment of brand risk and importance of other intangible assets also influence the overall corporate brand value. In our previous blog post we conveniently ignored an assessment of those elements in presenting our updated calculation by simply using FY2014 data in the model, thereby setting the stage for this discussion. But valuation is not a mechanistic approach, as it requires judgment and the consideration of alternative assumptions. In our original white paper, we presented a range of values based on sensitivity analyses regarding different inputs. In columns 3 and 4 of Table 1, we present a similar “low” and “high” case using the updated FY2014 model to illustrate a similar range of values.

Ultimately, the updated brand valuation also needs to assess how the critical brand attributes might have changed from one year to the next, where we evaluate the potential changes in consumer perceptions and buying behavior. A more negative view will increase the risk the brand cash flows will be realized, which can be reflected in the residual cash flows and/or the discount rate. We should also consider any change in the perception of the importance of other tangible and intangible assets (e.g., delivery network), such that we might revise our estimates of the return on tangible assets or the profit split between the delivery network, other IP and the brand.

Need help with a brand valuation and assessment?  Have a question about valuation?  Let us know!

Updating the Value of the USPS Corporate Brand

Earlier this year, the United States Postal Service Office of Inspector General (USPS OIG) released a white paper documenting our computation of the corporate brand value for the United States Postal Service. In our paper, we discussed the overall methodology and calculation, drawn from our extensive work identifying and characterizing the critical brand attributes of the Postal Service’s corporate brand. One of our key brand valuation model requirements was to build a transparent and easily reproducible model that depended on publicly-available inputs (i.e., non-proprietary data). As part of our brand valuation process, we implemented the residual income approach using Fiscal Year (FY) 2013 results, as these data were the most reliable public data available at that time we finalized our valuation in October 2014. However, more contemporaneous data have become available. As a result, we can update our brand value calculation to see how the value has changed and more importantly, if the changes make sense in the context of the role and performance of the Postal Service. In this first blog post, we update our brand valuation model using FY2014 data. In our next post, we will examine whether the update makes sense and the reasons why (or why not)!

The residual income approach isolates the cash flow or income that is solely attributable to the intangible asset under study (in this case the Postal Service brand). We accomplish this by following a three-step process where we:

  1. Normalize the financial data to account for financial anomalies created by either regulatory or operating constraints.
  1. Deduct returns associated with identifiable tangible and intangible assets to isolate the brand-specific cash flow.
  1. Compute the brand value by capitalizing the brand-specific cash flow using an appropriate rate.

The first step in updating our brand valuation model was incorporating the FY2014 financial data. In FY2014, the Postal Service posted a loss of approximately $5.51 billion. As discussed in our original white paper, the Postal Service operates under various constraints and limitations that contribute to the significant losses it has incurred over the past three years. These constraints and limitations affect its financial condition in a generally adverse way and are the result of the circumstances that the USPS faces as a quasi-public entity that it would not face if it operated in a normal, competitive market. As a result, we normalize the income statement by making three adjustments:

  • Adjustments for the cost of providing universal service (USO)
  • Recognizing the value added through mailbox and letter monopolies
  • Deduction of accrued expenses that the Postal Service acknowledges as costs that are legally-mandated but not under its control

In following our original methodology, we normalize the income statement for the USO by netting the mailbox/letter monopolies against the cost of the USO. We rely on estimates from the Postal Regulatory Commission (PRC) for these inputs, which are included in the PRC Annual Report to Congress. We also remove the accrued expenses that the Postal Service acknowledges as costs that are not under its control but are legally-mandated. These include the pre-funding of retirement health benefits and accounting changes to the workers’ compensation expenses.

In the second step, we compute a return on tangible contributory assets, including physical assets such as buildings, equipment and property, utilized the book value of the physical assets taken from the Postal Service balance sheet and assigned a return based on the market cost of funding these assets. In following our white paper methodology, we use a profit split approach to split the residual income between the brand intangible and the other intangible assets, allocating 80 percent of the residual income to the delivery system and network intangible and 20 percent of the residual income to the brand.

In our final step we isolate the cash flow stream that we deemed attributable to the brand and capitalize it using an appropriate capitalization rate. The capitalization rate is the discount rate less the long-term growth rate for the brand-related cash flows. The discount rate represents the required rate of return for an investment in the Postal Service corporate brand. The discount rate is a measure of the investment (brand), which includes the risk associated with receiving expected cash flows generated by the subject investment. As summarized in the following table, we compute a brand value of $6.23 billion for the Postal Service corporate brand. Although this value is within the range of values ($1.82 billion to $13.25 billion) we computed previously under different assumptions using FY2013 data, it nevertheless represents a significant increase over the $3.63 billion base value we computed in our original white paper.

USPSBrandValueTable

So what leads to the difference in the year-to-year brand value? Is the difference reasonable? In our next blog post, we investigate the drivers of the updated brand value and test the reasonableness of the change in values.

Interested to know what your brand is worth? Have questions about how you can identify and leverage key brand attributes? Let us know how we can help.